Shapley Value Attribution Research
Projects | | Links:
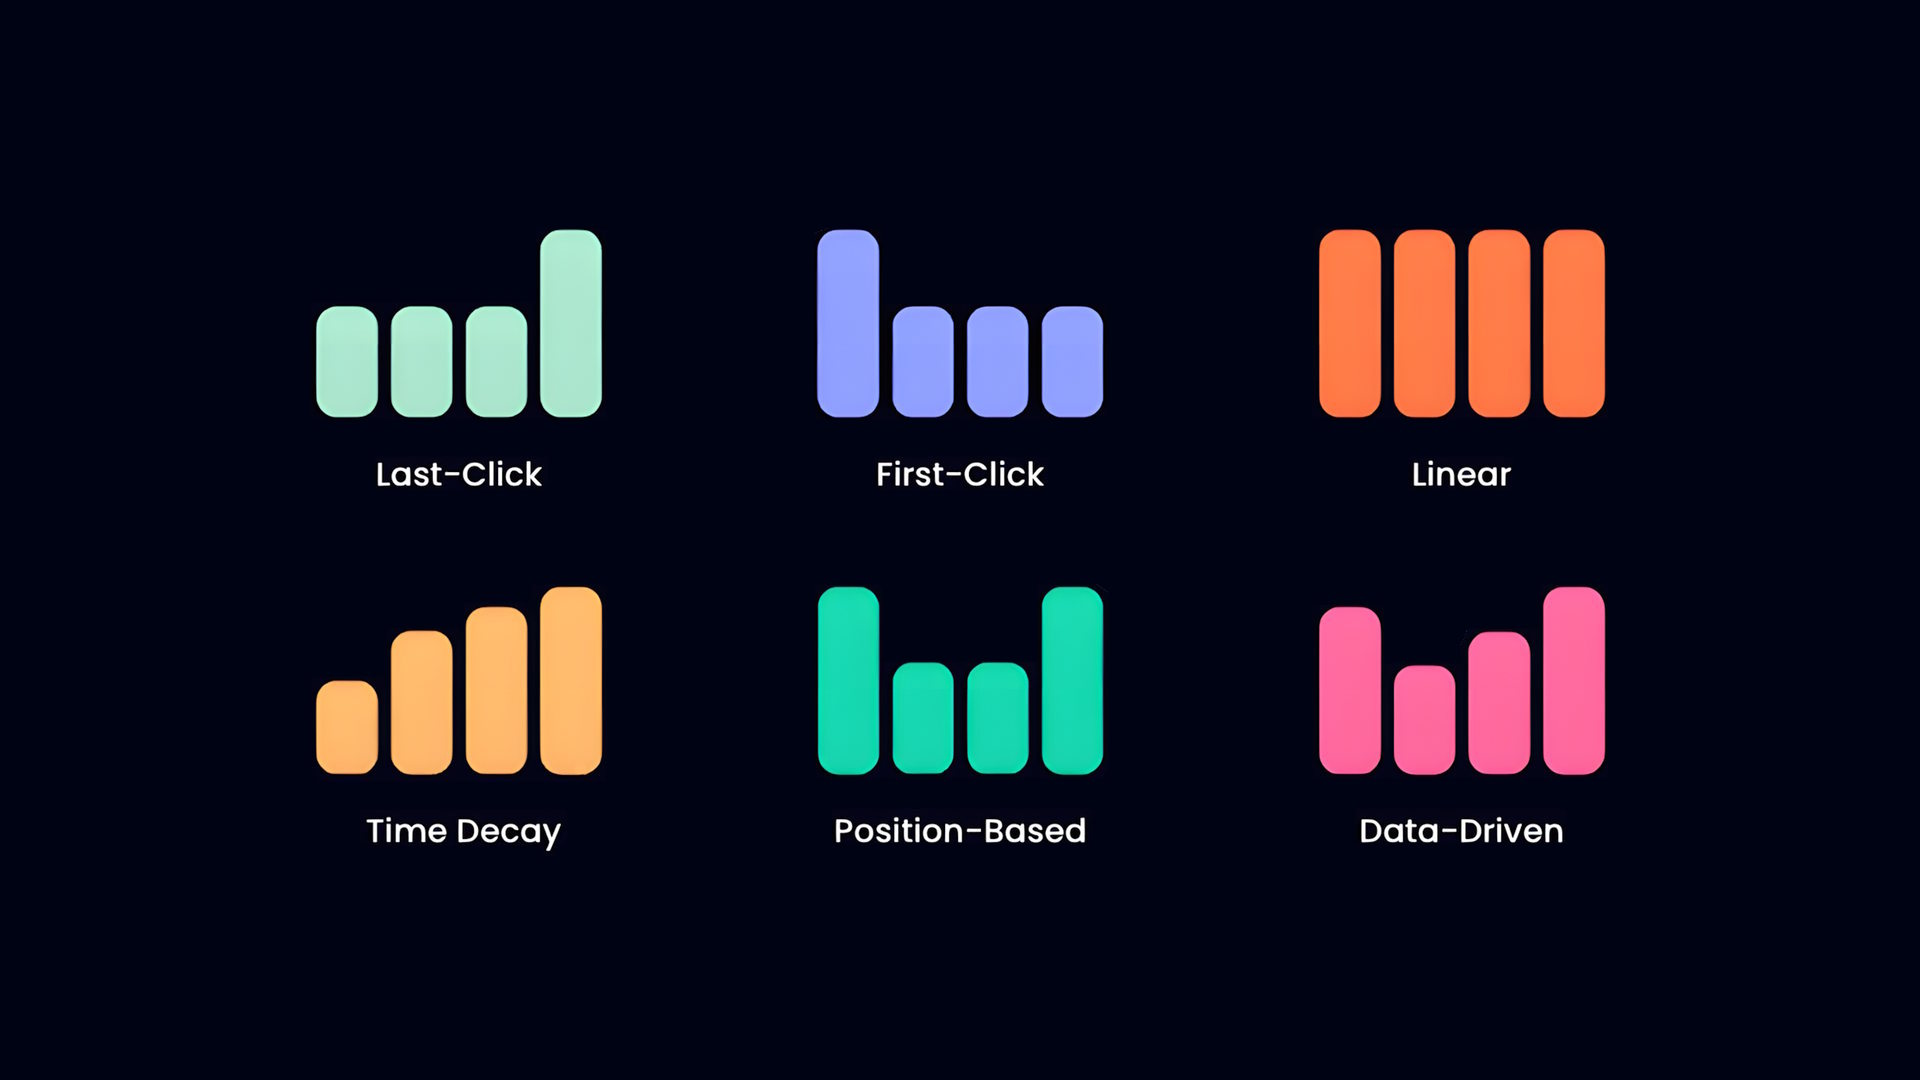
A comparison of customer attribution models, which assign credit based on a touchpoint’s fixed position in a timeline. While the first five models follow defined patterns, the final icon represents a probabilistic approach using mathematically calculated contributions of each interaction by comparing various conversion paths.
In 2019, during my time at Scan Computers, I was tasked with evaluating whether our investment in Google AdWords was generating enough incremental sales to justify the cost. The primary challenge was determining if paid search was driving new customer acquisitions or simply intercepting loyal customers who would have purchased via organic pathways regardless.
To address this, the company explored third-party attribution tools. One vendor offered a black box solution that claimed to use Shapley Value equations and Markov chains to perfectly map customer journeys. My role was to research these equations and audit the math to see if the vendor’s outputs were actually verifiable or merely a sophisticated guess.
Shapley Value Attribution Formula
In a nutshell, this formula calculates a weighted average of marginal contributions (\(\phi_j\)) to determine the fair share of credit for a sale. It operates by simulating every possible combination of marketing channels, referred to as coalitions (\(S\)), and measuring the difference in results when a specific channel (\(x_j\)) is added to that group versus when it is excluded.
My audit revealed that this fair distribution breaks down in high-noise environments. The math assumes every customer journey is a perfectly tracked, unbroken chain. However, I identified that real-world data gaps - such as cookie deletion, privacy blockers, and cross-device switching fragmented these chains. I concluded that the tool was performing high-level calculus on a foundation of broken data. By attributing value to the wrong touchpoints, the ‘mathematically optimal’ budget recommendations were fundamentally inaccurate. I presented these findings in a meeting with the vendor’s representatives. By asking key questions about their data sources and processing I was able to clarify the tool’s limitations, supporting my assessment. Based on my recommendation, the company director opted not to invest, saving the company significant capital on an ineffective product.
Through additional research, I found that the revenue attributed to Google AdWords closely mirrored what the business likely would have generated anyway. Many customers who were already intent on purchasing would simply click the top ad because it was the most convenient touchpoint - effectively claiming credit for demand that would have otherwise been fulfilled through direct or existing channels. When the company later decided to significantly reduce AdWords spend, the results showed that a large portion of those customers still completed their purchases through other means, which suggested the paid spend was largely redundant.
For further reading, I have added the following links to provide more information on the topic from recent blog posts and papers:
Why data-driven marketing attribution models don’t work as promised
Problems with Shapley-value-based explanations as feature importance measures